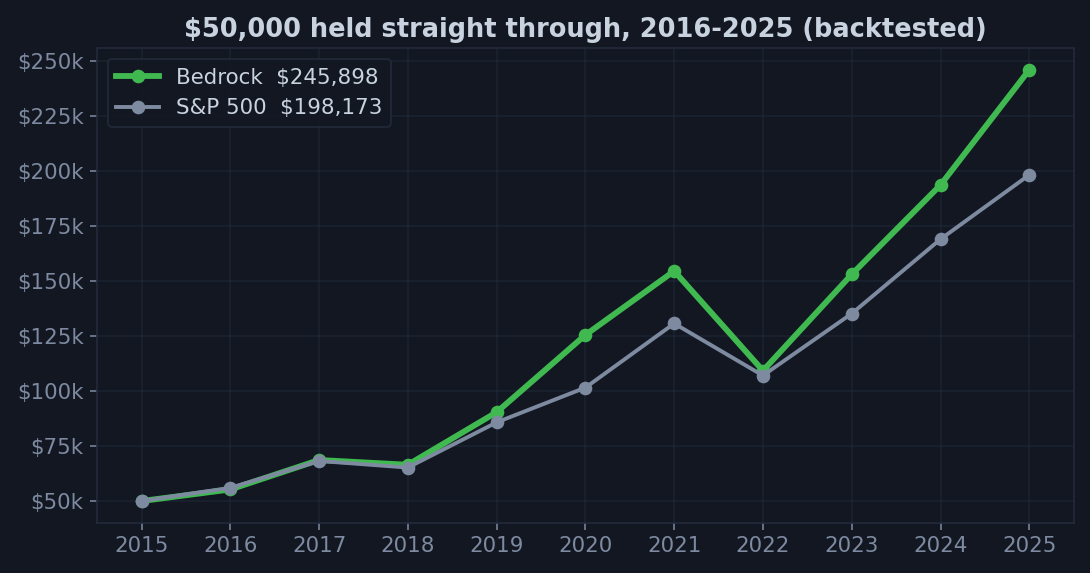
$50,000 became about $246,000
Held straight through 2016-2025, versus about $198,000 for the S&P 500. That is roughly 18% a year, backtested.
+40%
Best year · 2023
7 of 10
Years that beat +20%
-29%
Worst year · 2022
The headline 18% a year is the compounded rate across all ten years, the strong ones and the −29% in 2022. It is deliberately lower than our best years, because that is the return an investor actually kept.
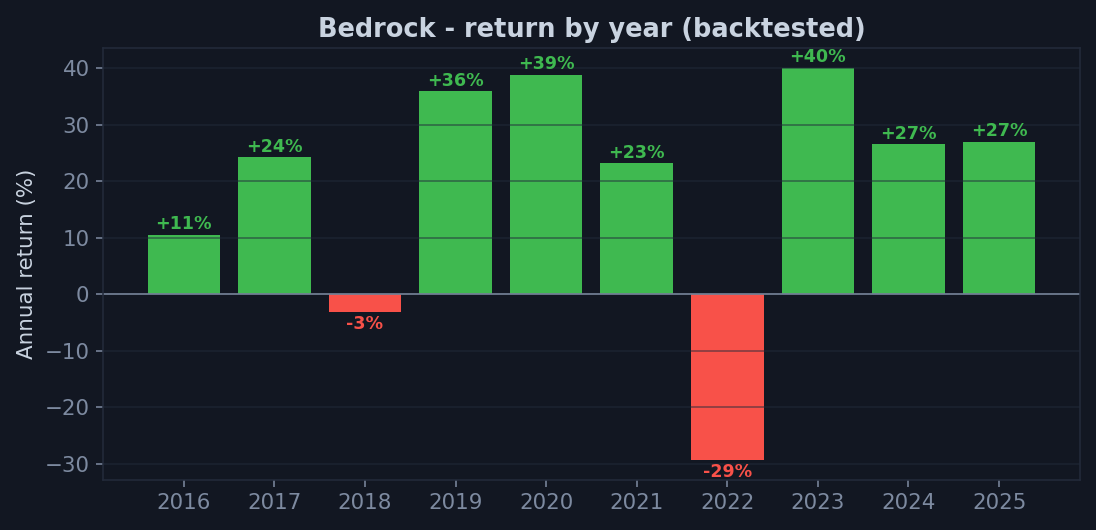
Year by year (backtested)
| Metric | 2016 | 2017 | 2018 | 2019 | 2020 | 2021 | 2022 | 2023 | 2024 | 2025 |
|---|---|---|---|---|---|---|---|---|---|---|
| Return | +11% | +24% | -3% | +36% | +39% | +23% | -29% | +40% | +27% | +27% |
| Worst drop | 6% | 4% | 18% | 6% | 24% | 8% | 33% | 12% | 9% | 18% |
| Sharpe | 0.70 | 2.50 | -0.27 | 2.33 | 1.22 | 1.33 | -1.00 | 1.80 | 1.06 | 0.89 |
Only two down years in ten (2018 and 2022).